Thinsage
The Course
This course is intended to be a semester long, project focused course, where I work directly under the supervision of Prof. Belcaid. At the beginning of the course I was given a choice of which project I would like to work on of course with approval from Mahdi. After some discussion, I chose to move forward with one of the projects suggested to me by Mahdi, called “Thinsage”. The project was to write a Python Library equipped with the tools to subsample or thin a data set of various types. There are many use cases for a library like this for anyone working with data. One could subsample potentially any data they wanted for any purpose such as data visualisation, machine learning, or general data exploration. I decided on this project for a few reasons. The main reason was I enjoyed writing python code, and I wanted to gain more experience in writing my own Python code, as well as learn more about how to write Python code cleaner and more efficiently.
In the Beginning
Upon beginning the project I was first assigned the task of researching other Python Libraries for two reasons: so I could understand how to structure complex code, and so I could see what’s already been done in terms of subsampling libraries. I must admit that at the beginning of this project I thought that structuring code would be a simple process if not done on the fly, so I didn’t understand why I was researching other libraries at all. Near the end of the project I started realizing how important a clean structure was. After getting a feel for the basic idea of the project, I started off with the basic subsampling methods which randomly subsampled generic data. There were a few different methods which could subsample not just numbers but abstract Objects containing any kind of data within them. I also implemented what we called Stratified subsampling where we look at a given labelling and subsample from each class. For example if we have a table of data including occupation, salary and age for men and women. The method would take the data and the labels to indicate which records are men and women, and would make sure to return a balanced subsample which would accurately represent the original data. A purely random subsample might take a lot of records from just the men for example, which would surely skew any patterns or conclusions gathered from the returned subsample.
Time Series
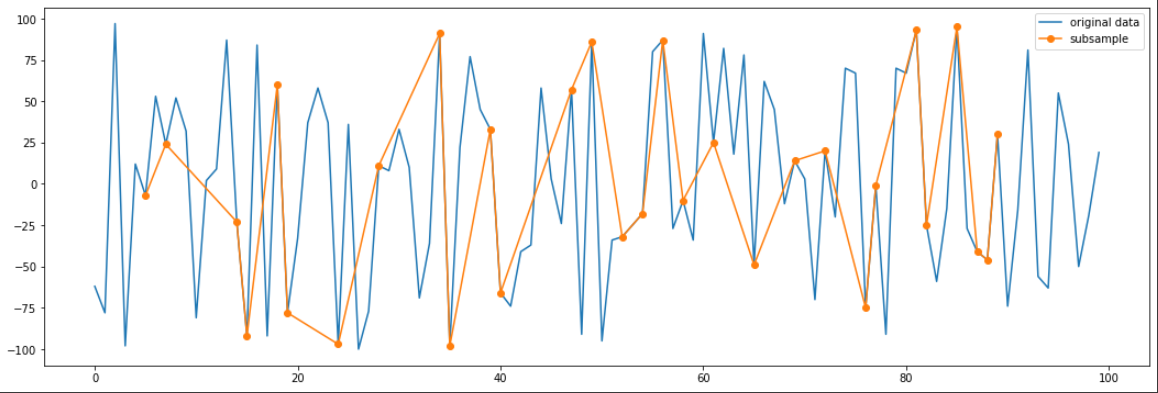
The next category I would take on is time series data. Time series data is any sort of data where one axis is time on a particular scale. For example stock market data over a period of time is an example of time series data. The X-axis is time and the Y-axis is the value of the stock at any given time. Subsampling from time series data, needs its own category because it can’t be sampled the same as generic tabular data. The data needs to be spread out well, represent the original data, and needs to be in the original order. For example if we were to randomly select data from a time series we might not get the best representation of the original data:

However with one of the more complex methods known as Largest Triangle Three Bucket (LTTB) we can fit the data with reasonable accuracy with just a handful of points

In total there are five different methods of subsampling time series each with their own pros and cons.
Multi-Feature
Another category we chose is what we called multi-feature subsampling. Imagine we’re trying to visualise clusters of data of people who smoke and don’t smoke, we can cluster them based on multiple features such as age, gender, location, marital status, number of children etc. multi-feature subsampling would take this tabular data and cluster the records into k clusters and take balanced samples from each cluster. This sounds familiar because it is, we were able to reuse code mentioned above. This is where I started to realize the importance of the structuring.
Image and PCA
The last major category was image subsampling. One could of course simply use the generic subsampling if they wanted random or if they have access to labels corresponding to the data use the methods mentioned at the beginning of this report. However, we went one step further and were able to implement PCA for dimensionality reduction. This allowed us to again reuse code and cluster images based on their reduced form and return balanced subsamples. For example, if we have 1000 images of dogs and 5000 images of cats, we can use this PCA subsampling and ideally return x images of dogs and y images of cats, where x is approx. equal to y.
Conclusion
After writing all these methods and classes, Mahdi worked with me to help structure the code in a clean and efficient way. Coming away from this project I learned a lot. I learned a lot about working with different types of data and what’s important when working with each type. I learned about writing clean efficient Pythonic code and how to structure complex code which interweave with each other. I also gained more experience in writing my own code which really helped me understand the basics such as clearly naming variables and methods and reusability of code.